Distributions are a useful way to reason about all kinds of things.
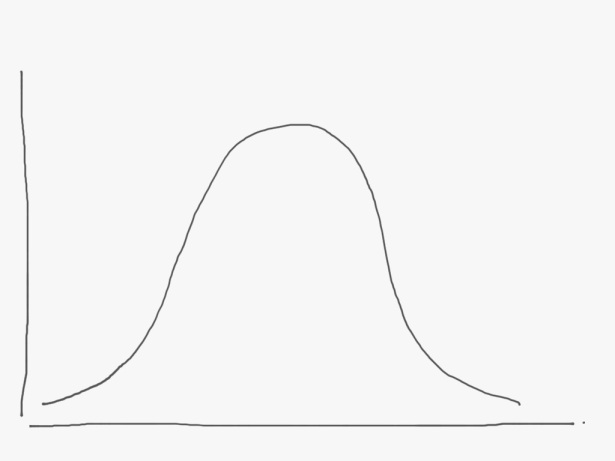
Here’s a familiar one, the normal distribution, or “the bell curve.”
A bell curve basically says that most of the data points are bunched up around some midpoint. So in a population of men, say, most of them will be 5’9″ or thereabouts, with few really tall and few really short guys. So in my above napkin sketch, the x axis would have a value of 5’9″ right under the peak of the curve.
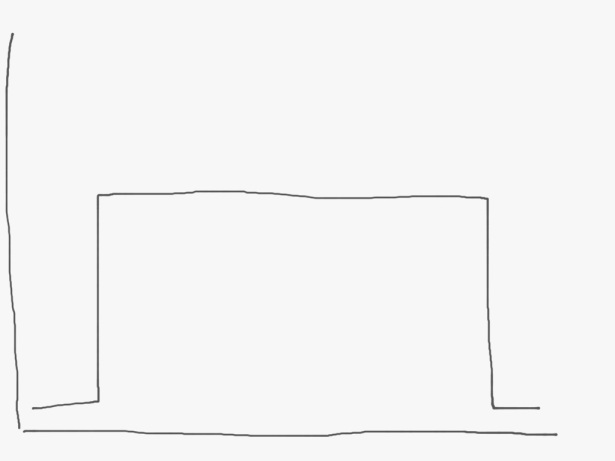
Here’s another one, the uniform distribution.

This says that the data points are distributed equally. Tossing a die is a good example – any possible outcome (1 through 6) is equally likely to occur. In the above distribution, imagine we have a six sided die. The x axis would be 1 right where the curve starts on the left, and 6 where the curve ends on the right*.
These distributions make intuitive sense, they seem to describe a lot of stuff we observe in the world.
But not everything is distributed like a bell curve, or a uniform curve. In fact, a lot of people think that everything is either normal or uniform, but this is not true!
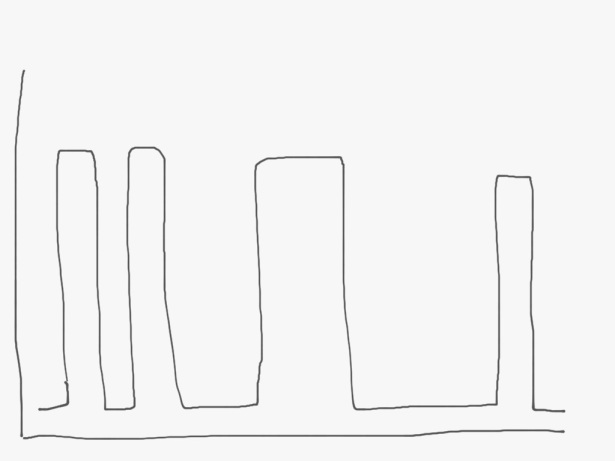
You’ve probably seen Pareto, or “long-tail” curves. But I’d like to focus on multi-modal, “lumpy” distributions. Like this:

That is, there are bunches of data gathered around a point and then lots of nothing in between them.
Why is this concept important? Because a lot of patterns in life are multi-modal, and if you mistake them for a uniform (or normal), you can make bad decisions. And the thing is, it is really tempting to make this mistake.
Let’s start with a basic example. Say you are trying to price a product, and you are thinking about a price between $79 and $99. Imagine we populate a curve to get at this price sensitivity question. Each potential buyer has a max price they will pay, and we mark them down on the x-axis of a distribution, where x is price. Conventional wisdom will tell you that you’ll get a lump at $79, and a lump at $99. That means there is NO POINT in pricing your product anything in between these two price points. In other words, demand curves are not smooth, but lumpy.
(Tangential entrepreneur thought: people spend WAY too much time thinking about pricing, as opposed to just focusing on building the best product. In most new-ish markets, people will pay more for the best – price sensitivity is totally besides the point.)
A more interesting example. Say you are trying to hire a software developer, and you imagine talent level as a distribution among a group of professionals. I believe this distribution is neither uniform nor normal – it’s multimodal. (I can’t prove this, but my experience tells me this is true.) That is, there are a set of super amazing excellent people, and then a bunch of competent people, and then there are terrible people, and well, nothing in between these groups. There is no “well, she’s almost amazing, just missing X,Y …” person. The person is either amazing, or competent. Nothing in between. So how does this change your hiring practices?
It’s easy to make bad compromises if you view a pattern as uniform or normal when it’s not. In fact, it’s better, in my view, to mistake patterns as modal than to mistake them as uniform.

Discussing the hiring example… I believe that with a large enough pool the distribution of applicant “talent” is normal. I would wager that your evaluation criteria are too discrete, creating distinct buckets that you place people in. If you actually hired all these people and worked with them for a year, you would have a much larger data set to value them on, and the distribution would tend to normal.
You could be right – but I don’t think so. Of course, I don’t have tons of data on talent levels for given disciplines, and this is subjective anyway, so I can’t and won’t prove my point. But in my experience, even across large groups of people, the distribution is modal. My graph is a little misleading in that each hump is equally sized, which is certainly false – there are far fewer super talented people than pretty good people.
So, we’re probably both right – when it comes to talent, the actual distribution is probably a lumpy (modal) normal, with gaps in between each lump.